Note
Go to the end to download the full example code.
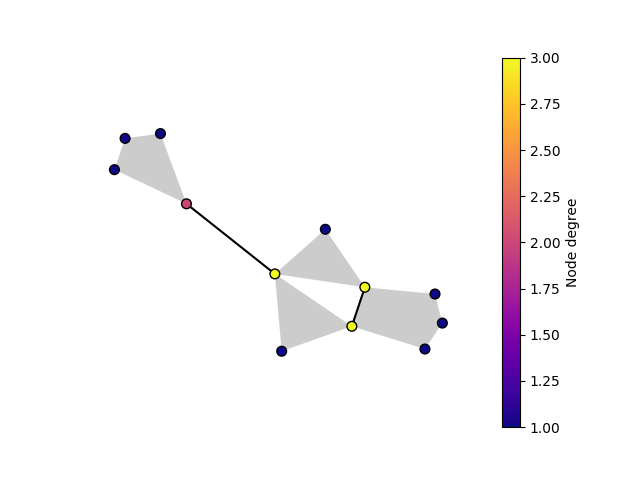
Color based on stat#
Set node colors based on stat
import matplotlib.pyplot as plt

import xgi

hyperedges = [[1, 2, 3], [3, 4, 5], [3, 6], [6, 7, 8, 9], [1, 4, 10, 11, 12], [1, 4]]
H = xgi.Hypergraph(hyperedges)

pos = xgi.barycenter_spring_layout(H, seed=1)

ax, collections = xgi.draw(
    H,
    pos=pos,
    node_fc=H.nodes.degree,
    edge_fc="grey",
    node_fc_cmap="plasma",
)

node_col, _, edge_col = collections

plt.colorbar(node_col, label="Node degree")
plt.show()
Total running time of the script: (0 minutes 0.045 seconds)