In Depth 1 - Drawing nodes
Here we show the fuctionalities and parameters of xgi.draw_nodes(). It is similar to the networkx corresponding function (+ some bonus) and heavily relies on matplotlib’s scatter function.
[1]:
import matplotlib.pyplot as plt
import numpy as np

import xgi
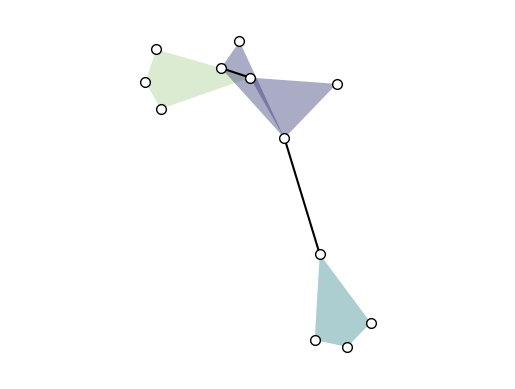
Les us first create a small toy hypergraph containing edges of different sizes.
[2]:
edges = [[1, 2, 3], [3, 4, 5], [3, 6], [6, 7, 8, 9], [1, 4, 10, 11, 12], [1, 4]]

H = xgi.Hypergraph(edges)

pos = xgi.barycenter_spring_layout(H, seed=42)  # fix position
[3]:
xgi.draw(H, pos);
Basics
Let’s jump right into how xgi.draw_nodes() works. By default, it gives:
[4]:
ax, node_collection = xgi.draw_nodes(H, pos)
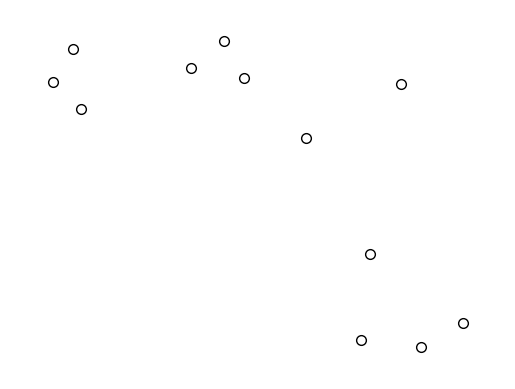
Note that it returns a tuple (Axes, PathCollection). The PathCollection is what matplotlib’s plt.scatter() returns and can be used later to plot a colorbar.
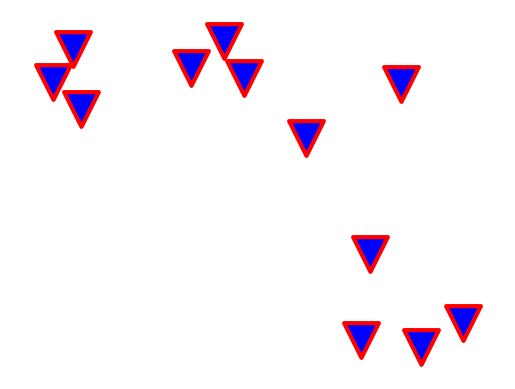
The color, size, linewidth, and shape of the nodes can all be customised:
[5]:
ax, node_collection = xgi.draw_nodes(
    H, pos, node_fc="b", node_ec="r", node_shape="v", node_size=25, node_lw=3
)
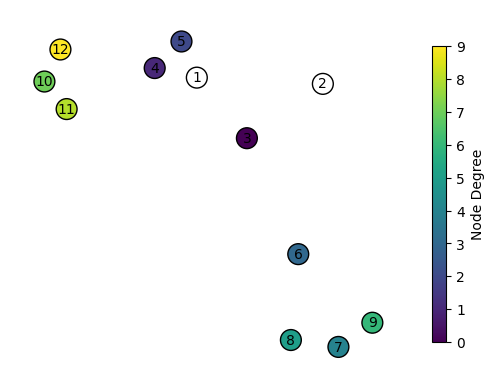
Colormaps
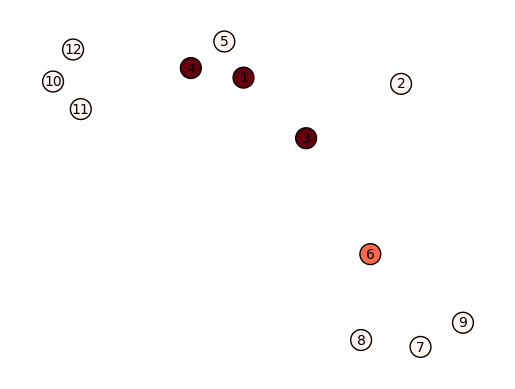
In XGI, you can easily color nodes according to a NodeStat, or just an array or a dict:
[6]:
ax, node_collection = xgi.draw_nodes(
    H, pos, node_fc=H.nodes.degree(), node_labels=True, node_size=15
)
print(H.nodes.degree().asdict())
{1: 3, 2: 1, 3: 3, 4: 3, 5: 1, 6: 2, 7: 1, 8: 1, 9: 1, 10: 1, 11: 1, 12: 1}
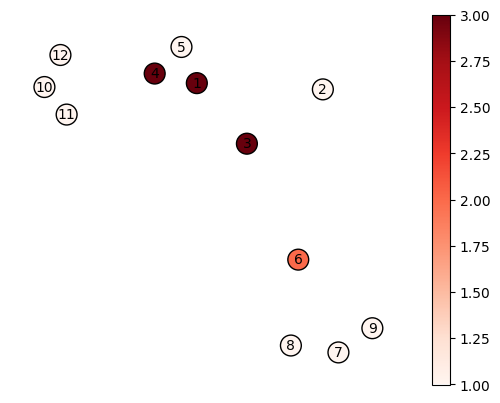
By default, the colormap used is "Reds". To visualise the values corresponding to the colors, nothing easier than plotting a colorbar:
[7]:
ax, node_collection = xgi.draw_nodes(
    H, pos, node_fc=H.nodes.degree(), node_labels=True, node_size=15
)
print(H.nodes.degree().asdict())
plt.colorbar(node_collection)
plt.show()
{1: 3, 2: 1, 3: 3, 4: 3, 5: 1, 6: 2, 7: 1, 8: 1, 9: 1, 10: 1, 11: 1, 12: 1}
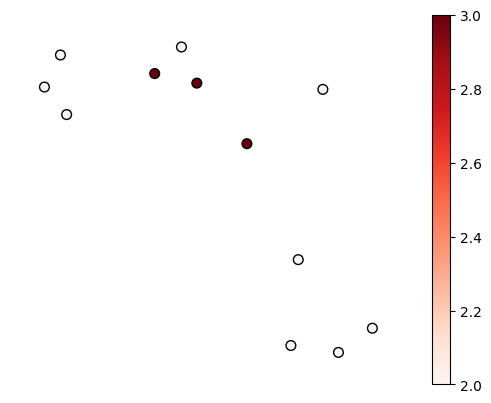
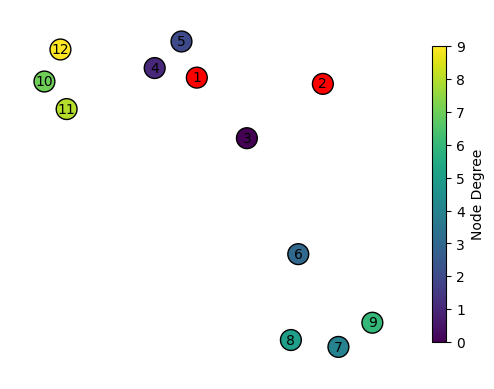
You can specify a vmin and vmax for the node colors:
[8]:
ax, node_collection = xgi.draw_nodes(H, pos, node_fc=H.nodes.degree(), vmin=2)
plt.colorbar(node_collection)
plt.show()
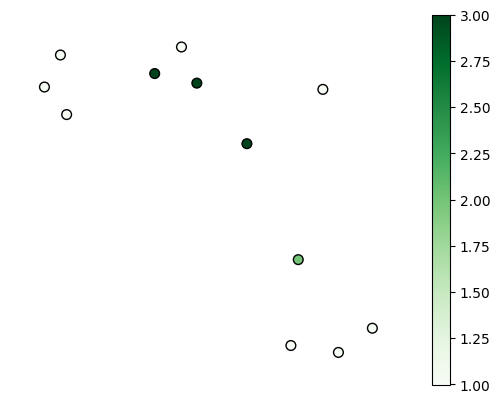
It’s also easy to specify a different colormap:
[9]:
ax, node_collection = xgi.draw_nodes(
    H, pos, node_fc=H.nodes.degree(), node_fc_cmap="Greens"
)

plt.colorbar(node_collection)
plt.show()
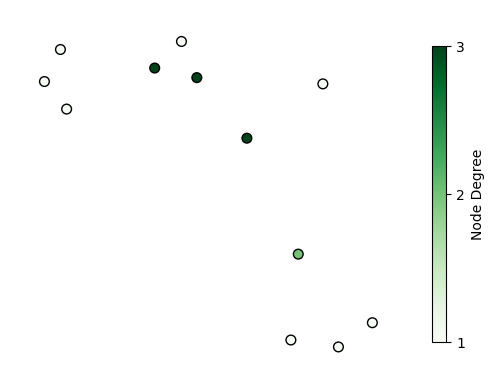
And of course, all the colorbar customisation offered by matplotlib are available, for example:
[10]:
ax, node_collection = xgi.draw_nodes(
    H, pos, node_fc=H.nodes.degree(), node_fc_cmap="Greens"
)

plt.colorbar(node_collection, label="Node Degree", shrink=0.8, ticks=[1, 2, 3])
[10]:
<matplotlib.colorbar.Colorbar at 0x17e8018b0>
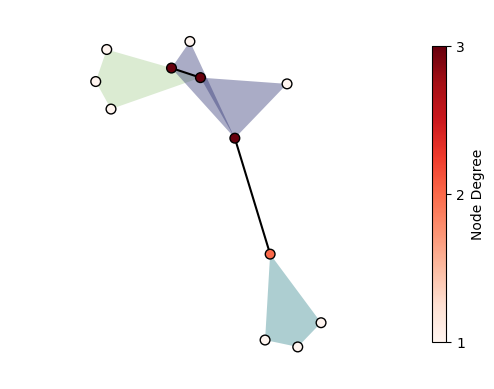
Combine with edges
This can be either via xgi.draw():
[11]:
ax, collections = xgi.draw(H, pos=pos, node_fc=H.nodes.degree())

(node_collection, _, _) = collections

plt.colorbar(node_collection, label="Node Degree", shrink=0.8, ticks=[1, 2, 3])
[11]:
<matplotlib.colorbar.Colorbar at 0x17e9d85e0>
Or by combining it with xgi.hyperedges() for more control:
[12]:
ax, node_collection = xgi.draw_nodes(H, pos=pos, node_fc=H.nodes.degree(), zorder=5)

ax = xgi.draw_hyperedges(H, pos=pos)

plt.colorbar(node_collection, label="Node Degree", shrink=0.8, ticks=[1, 2, 3])
[12]:
<matplotlib.colorbar.Colorbar at 0x17ea773d0>
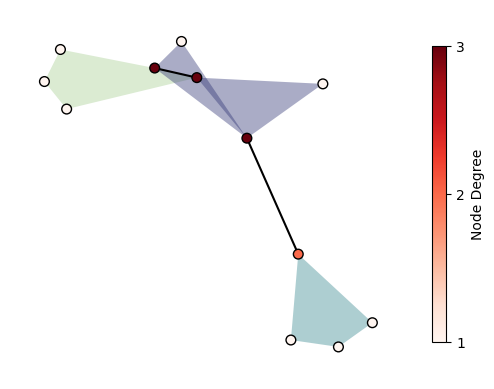
Notice that here we had to specify the zorder of the nodes which is 0 by default in xgi.draw_nodes()!
Non-finite values for node colors
By default, non-finite values (inf, nan) are plotted in the “bad” color of the cmap. Here, it is white by default:
[13]:
values = [np.inf, np.nan] + list(range(H.num_nodes - 2))  # values for node colors

ax, node_collection = xgi.draw_nodes(
    H, pos, node_fc=values, node_fc_cmap="viridis", node_labels=True, node_size=15
)

plt.colorbar(node_collection, label="Node Degree", shrink=0.8)
plt.show()
The default can be changed, for example here to red:
[14]:
values = [np.inf, np.nan] + list(range(H.num_nodes - 2))

cmap = plt.cm.viridis
cmap.set_bad("red")  # set bad

ax, node_collection = xgi.draw_nodes(
    H, pos, node_fc=values, node_fc_cmap=cmap, node_labels=True, node_size=15
)

plt.colorbar(node_collection, label="Node Degree", shrink=0.8)
plt.show()
[ ]: