In depth 2 - Drawing hyperedges
Here we show the fuctionalities and parameters of xgi.draw_hyperedges(). It is similar to the networkx corresponding function (+ some bonus) and heavily relies on matplotlib’s Collection plotting.
[1]:
import matplotlib.pyplot as plt

import xgi
Les us first create a small toy hypergraph containing edges of different sizes.
[2]:
edges = [[1, 2, 3], [3, 4, 5], [3, 6], [6, 7, 8, 9], [1, 4, 10, 11, 12], [1, 4], [2, 5]]
H = xgi.Hypergraph(edges)

pos = xgi.barycenter_spring_layout(H, seed=42)  # fix position
[3]:
xgi.draw(H, pos=pos);
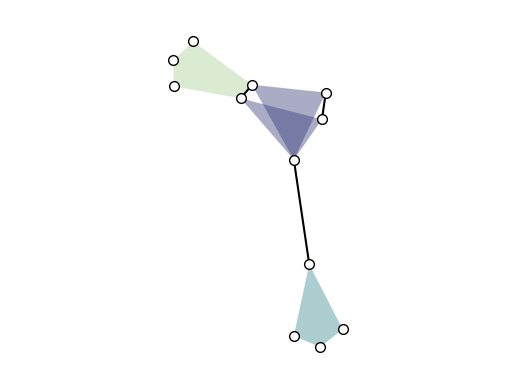
Basics
Let’s jump right into how xgi.draw_hyperedges() works. By default, it gives:
[4]:
xgi.draw_hyperedges(H, pos=pos)
[4]:
(<Axes: >,
 (<matplotlib.collections.LineCollection at 0x177de6b50>,
  <matplotlib.collections.PatchCollection at 0x177de6fa0>))
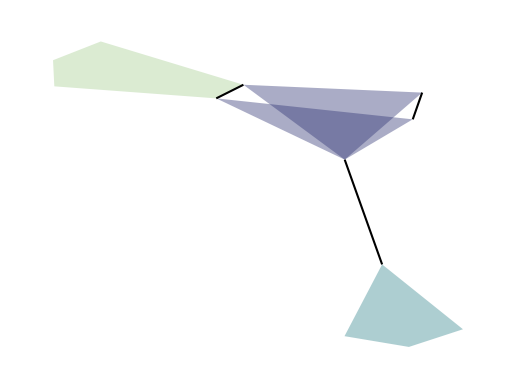
Notice that this function returns a tuple (ax, collections) where collections is a tuple (dyad_collection, edge_collection). The collections can be used to plot colorbars as we will see later.
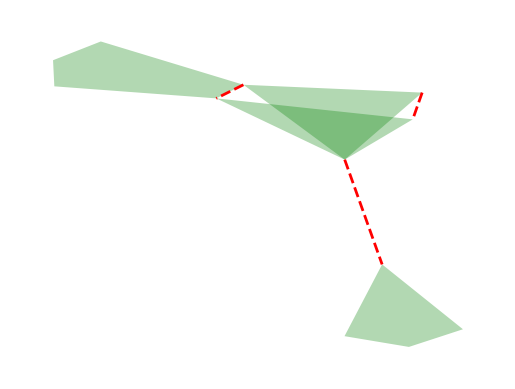
The color, linewidth, transparancy, and style of the hyperedges can all be customised, for example with single values:
[5]:
xgi.draw_hyperedges(
    H, pos=pos, dyad_color="r", dyad_lw=2, dyad_style="--", edge_fc="g", alpha=0.3
)
[5]:
(<Axes: >,
 (<matplotlib.collections.LineCollection at 0x177e11b80>,
  <matplotlib.collections.PatchCollection at 0x177e3c4c0>))
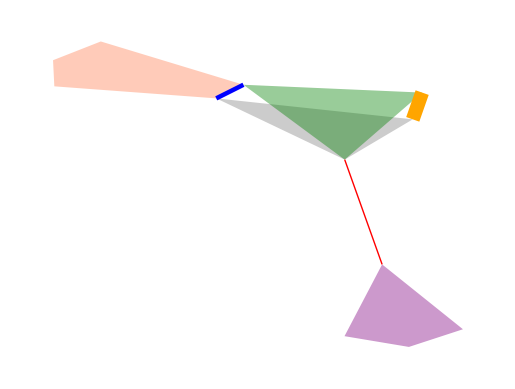
Or with multiple values:
[6]:
xgi.draw_hyperedges(
    H,
    pos=pos,
    dyad_color=["r", "b", "orange"],
    dyad_lw=[1, 2, 5],
    edge_fc=["g", "grey", "purple", "coral"],
)
[6]:
(<Axes: >,
 (<matplotlib.collections.LineCollection at 0x177e5ad60>,
  <matplotlib.collections.PatchCollection at 0x177e70400>))
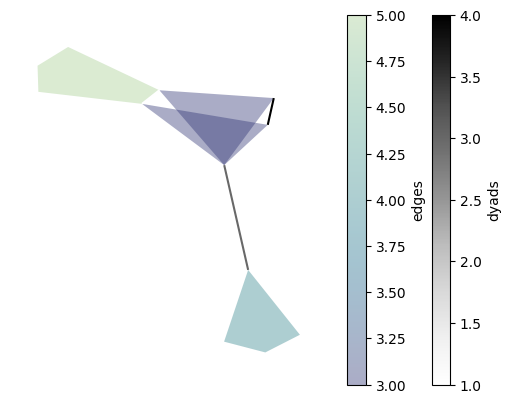
Arrays of floats and colormaps
In XGI, you can easily color hyperedges according to an EdgeStat, or just an array or a dict with float values:
[7]:
ax, (dyad_collection, edge_collection) = xgi.draw_hyperedges(
    H,
    pos=pos,
    dyad_color=[3, 1, 4],
    edge_fc=H.edges.size,
)

plt.colorbar(dyad_collection, label="dyads")
plt.colorbar(edge_collection, label="edges")
[7]:
<matplotlib.colorbar.Colorbar at 0x177f35fa0>
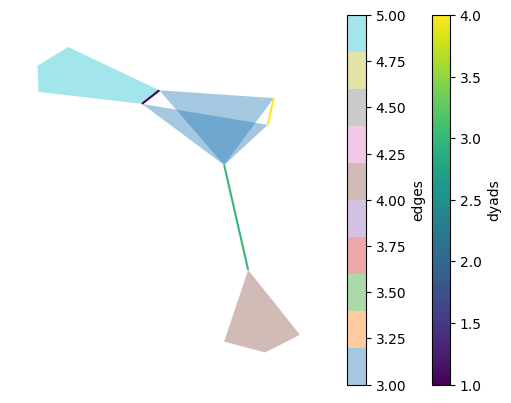
By default, the colormaps used are “crest_r” and “Greys”. These can be changed:
[8]:
ax, (dyad_collection, edge_collection) = xgi.draw_hyperedges(
    H,
    pos=pos,
    dyad_color=[3, 1, 4],
    edge_fc=H.edges.size,
    dyad_color_cmap="viridis",
    edge_fc_cmap="tab10",
)

plt.colorbar(dyad_collection, label="dyads")
plt.colorbar(edge_collection, label="edges")
[8]:
<matplotlib.colorbar.Colorbar at 0x28805d790>
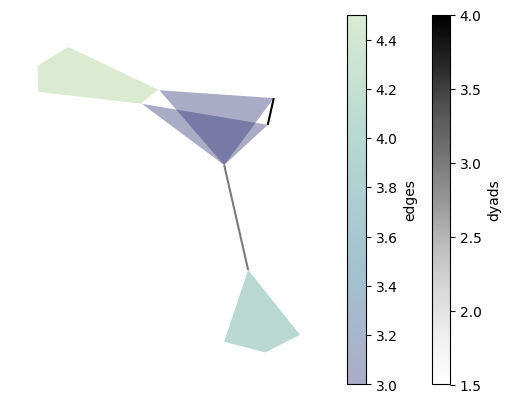
You can specify a vmin and vmax for the dyad and edge colors:
[9]:
ax, (dyad_collection, edge_collection) = xgi.draw_hyperedges(
    H, pos=pos, dyad_color=[3, 1, 4], edge_fc=H.edges.size, dyad_vmin=1.5, edge_vmax=4.5
)

plt.colorbar(dyad_collection, label="dyads")
plt.colorbar(edge_collection, label="edges")
[9]:
<matplotlib.colorbar.Colorbar at 0x288166b20>
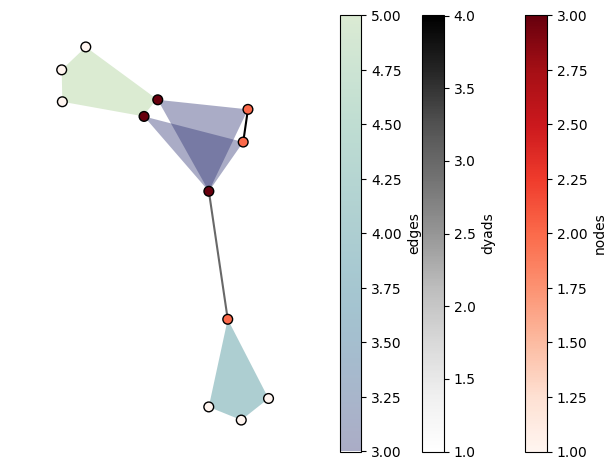
Combine with nodes
This can be done either via xgi.draw():
[10]:
ax, collections = xgi.draw(
    H,
    pos=pos,
    node_fc=H.nodes.degree,
    dyad_color=[3, 1, 4],
    edge_fc=H.edges.size,
)

(node_collection, dyad_collection, edge_collection) = collections
plt.colorbar(node_collection, label="nodes")
plt.colorbar(dyad_collection, label="dyads")
plt.colorbar(edge_collection, label="edges")

plt.tight_layout()
or plotting the nodes and the edges separately:
[11]:
ax, (dyad_collection, edge_collection) = xgi.draw_hyperedges(
    H, pos=pos, dyad_color=[3, 1, 4], edge_fc=H.edges.size
)

ax, node_collection = xgi.draw_nodes(H, pos=pos, node_fc=H.nodes.degree, zorder=3)

plt.colorbar(node_collection, label="nodes")
plt.colorbar(dyad_collection, label="dyads")
plt.colorbar(edge_collection, label="edges")

plt.tight_layout()
