In Depth 4 - Drawing multilayer-style
Here we show the fuctionalities and parameters of xgi.draw_multilayer().
[1]:
import matplotlib.pyplot as plt

import xgi
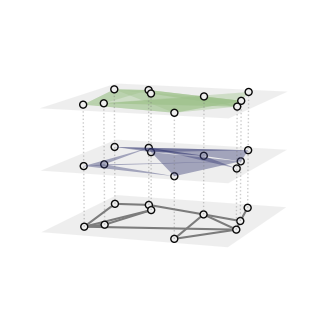
Les us first create a small toy hypergraph containing edges of different sizes.
[2]:
H = xgi.random_hypergraph(N=10, ps=[0.2, 0.05, 0.05], seed=1)
[3]:
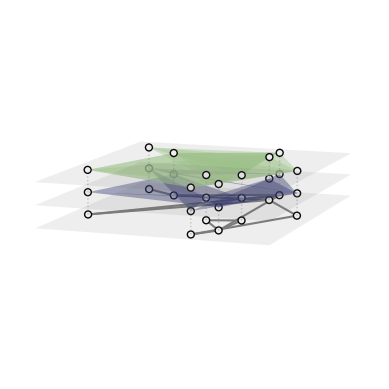
ax = plt.axes(projection="3d")
xgi.draw_multilayer(H, ax=ax)

plt.show()
/Users/maxime/Dropbox (ISI Foundation)/WORK/SCIENCE/xgi/xgi/drawing/draw.py:1479: UserWarning: No data for colormapping provided via 'c'. Parameters 'cmap' will be ignored
  node_collection = ax.scatter(
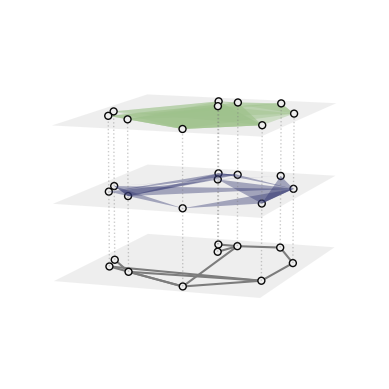
Basics
Notice that this function returns a tuple (ax, collections) where collections is a tuple (node_collection, edge_collection). The collections can be used to plot colorbars as we will see later.
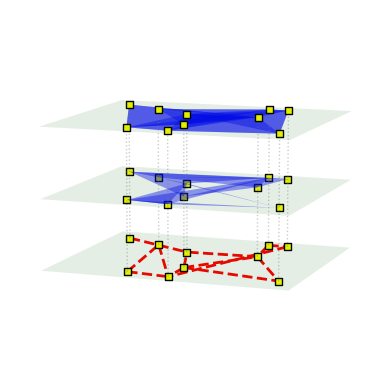
The color, linewidth, transparancy, and style of the hyperedges can all be customised, for example with single values:
[4]:
pos = xgi.barycenter_spring_layout(H, seed=1)

ax = plt.axes(projection="3d")
xgi.draw_multilayer(
    H,
    ax=ax,
    pos=pos,
    node_fc="yellow",
    node_shape="s",
    dyad_color="r",
    dyad_style="--",
    dyad_lw=2,
    edge_fc="b",
    layer_color="g",
)

plt.show()
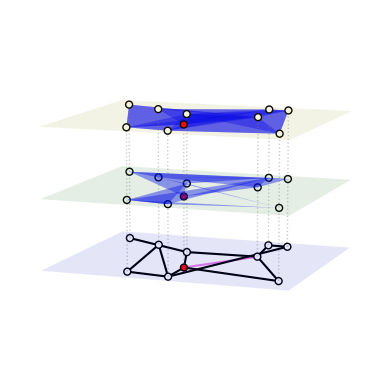
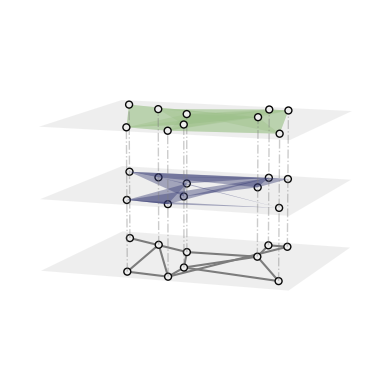
Or with multiple values:
[5]:
pos = xgi.barycenter_spring_layout(H, seed=1)

ax = plt.axes(projection="3d")
xgi.draw_multilayer(
    H,
    ax=ax,
    pos=pos,
    node_fc=["red"] + ["white"] * 9,
    dyad_color=["violet"] + ["k"] * 12,
    edge_fc="b",
    layer_color=["b", "g", "y"],
)

plt.show()
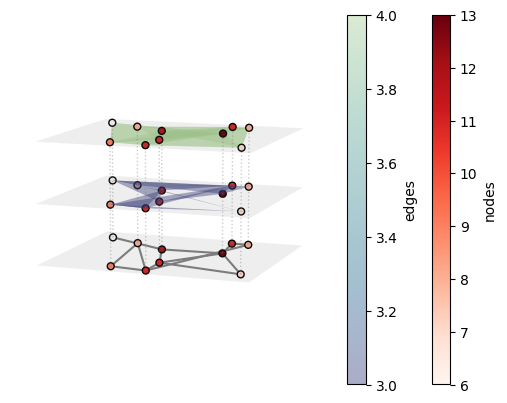
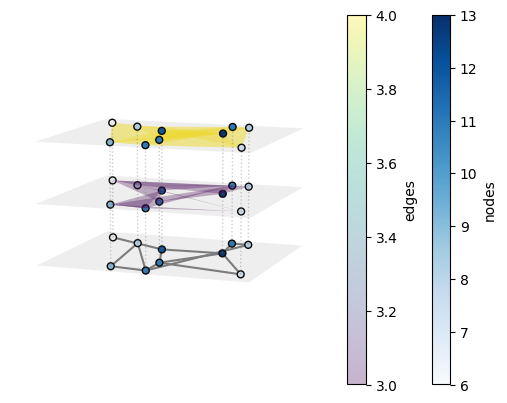
Arrays of floats and colormaps
In XGI, you can easily color hyperedges according to an EdgeStat, or just an array or a dict with float values:
[6]:
pos = xgi.barycenter_spring_layout(H, seed=1)

ax = plt.axes(projection="3d")
ax, collections = xgi.draw_multilayer(
    H, ax=ax, pos=pos, edge_fc=H.edges.size, node_fc=H.nodes.degree
)

node_coll, edge_coll = collections

plt.colorbar(node_coll, label="nodes")
plt.colorbar(edge_coll, label="edges")
[6]:
<matplotlib.colorbar.Colorbar at 0x2877d6b50>
By default, the colormaps used are “crest_r” and “Reds”. These can be changed:
[7]:
pos = xgi.barycenter_spring_layout(H, seed=1)

ax = plt.axes(projection="3d")
ax, collections = xgi.draw_multilayer(
    H,
    ax=ax,
    pos=pos,
    edge_fc=H.edges.size,
    node_fc=H.nodes.degree,
    node_fc_cmap="Blues",
    edge_fc_cmap="viridis",
    alpha=0.3,
)

node_coll, edge_coll = collections

plt.colorbar(node_coll, label="nodes")
plt.colorbar(edge_coll, label="edges")
[7]:
<matplotlib.colorbar.Colorbar at 0x2879bc850>
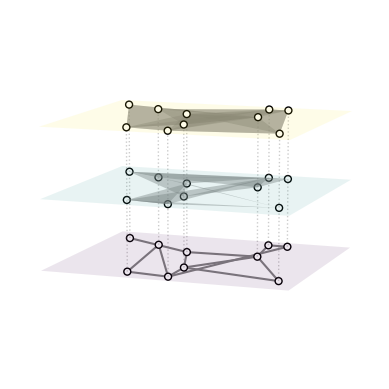
You can even have a cmap for the layers instead:
[8]:
pos = xgi.barycenter_spring_layout(H, seed=1)

ax = plt.axes(projection="3d")
ax, collections = xgi.draw_multilayer(
    H, ax=ax, pos=pos, edge_fc="grey", layer_color=[2, 3, 4], layer_cmap="viridis"
)

node_coll, edge_coll = collections

plt.show()
Styling of interlayer links
First you can simply remove them with conn_lines=False:
[9]:
pos = xgi.barycenter_spring_layout(H, seed=1)

ax = plt.axes(projection="3d")
ax, collections = xgi.draw_multilayer(H, ax=ax, pos=pos, conn_lines=False)

node_coll, edge_coll = collections

plt.show()

Or you can change their style with conn_lines_style:
[10]:
pos = xgi.barycenter_spring_layout(H, seed=1)

ax = plt.axes(projection="3d")
ax, collections = xgi.draw_multilayer(H, ax=ax, pos=pos, conn_lines_style="-.")

node_coll, edge_coll = collections

plt.show()
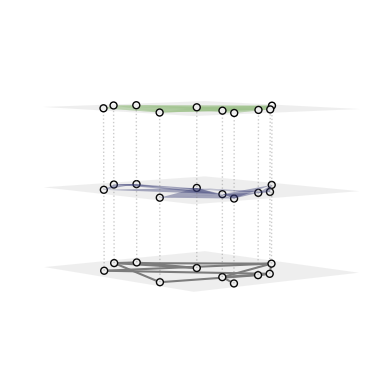
Set the height between layers and the view angles
By default the height between layers is sep=0.4:
[11]:
ax = plt.axes(projection="3d")
xgi.draw_multilayer(H, ax=ax, sep=0.4)

plt.show()
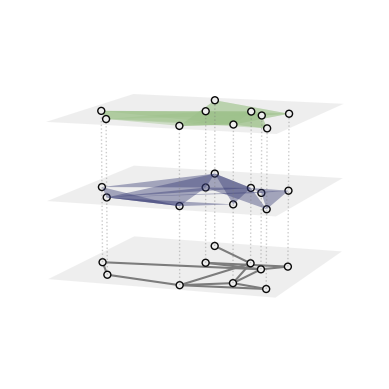
This can be changed!
[12]:
ax = plt.axes(projection="3d")
xgi.draw_multilayer(H, ax=ax, sep=0.1)

plt.show()

ax = plt.axes(projection="3d")
xgi.draw_multilayer(H, ax=ax, sep=1)

plt.show()
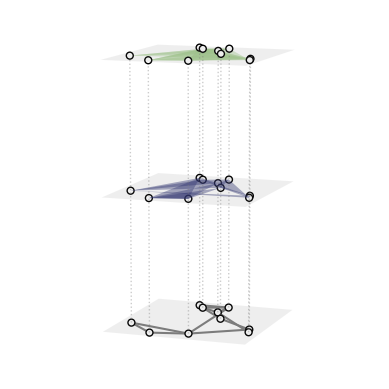
Similarly, the default view angles are h_angle=10, v_angle=20, but can be changed:
[13]:
ax = plt.axes(projection="3d")
xgi.draw_multilayer(H, ax=ax, h_angle=5, v_angle=50)

plt.show()
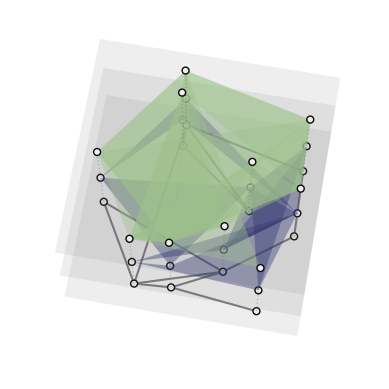
[14]:
ax = plt.axes(projection="3d")
xgi.draw_multilayer(H, ax=ax, h_angle=70, v_angle=10)

plt.show()
Control axis size
You can control the size of the axis by passing a custom made Axis3d like so:
[15]:
_, ax = plt.subplots(figsize=(4, 4), subplot_kw={"projection": "3d"})
xgi.draw_multilayer(H, ax=ax)

plt.show()
[16]:
plt.close(
    "all"
)  # closes existing ax3d to avoid bugs in next notebooks when running notebook tests