Directed Hypergraphs
[1]:
import matplotlib.pyplot as plt

import xgi
A directed hypergraph (or dihypergraph), is a hypergraph which keeps track of senders and receivers in a given interaction. As defined in “Hypergraph Theory: An Introduction” by Alain Bretto, dihypergraphs are a set of nodes and a set of directed edges.
We define a directed hyperedge \(\overrightarrow{e_i} \in E\) as an ordered pair \((e^+_i, e^-_i)\), where the tail of the edge, \(e^+_i\), is the set of senders and the head, \(e^-_i\), is the set of receivers. Both are subsets of the node set. We define the members of \(\overrightarrow{e_i}\) as \(e_i = e^+_i \cup e^-_i\) and the edge size as \(s_i = |e_i|\). Likewise, we define the in-degree, out-degree, and degree of a node \(i\) as
respectively, where \({\bf 1}\) is the indicator function.
These types of hypergraphs are useful for representing, for example, chemical reactions (which have reactants and products) and emails (sender and receivers).
We start by building a dihypergraph.
Building a dihypergraph
We can either build a dihypergraph node-by-node and edge-by-edge, or we can initialize a dihypergraph through its constructor.
We start by building a dihypergraph from the bottom up.
[2]:
DH = xgi.DiHypergraph()
print(DH)

DH.add_node(0, name="test")
DH.add_edge(
    [{1, 2, 3}, {3, 4}]
)  # Notice that the head and the tail need not be disjoint.

DH.add_nodes_from([5, 6, 7])
edges = [[{1, 2}, {5, 6}], [{4}, {1, 3}]]
DH.add_edges_from(edges)
DH["name"] = "test"

print("Now that we've added nodes and edges, we have a " + str(DH))
Unnamed DiHypergraph with 0 nodes and 0 hyperedges
Now that we've added nodes and edges, we have a DiHypergraph named test with 8 nodes and 3 hyperedges
We can also add edge with attributes!
[3]:
edges = [
    (([0, 1], [1, 2]), "one", {"color": "red"}),
    (([2, 3, 4], []), "two", {"color": "blue", "age": 40}),
]
DH.add_edges_from(edges)
We can also use the constructor to initialize a dihypergraph:
[4]:
# from a list
DH1 = xgi.DiHypergraph([[{1, 2}, {5, 6}], [{4}, {1, 3}]])

# from a dict
DH2 = xgi.DiHypergraph({1: ({1, 2, 3}, {3, 4}), 2: ({1, 2}, {3})})

# from another dihypergraph
DH3 = xgi.DiHypergraph(DH1)
Drawing
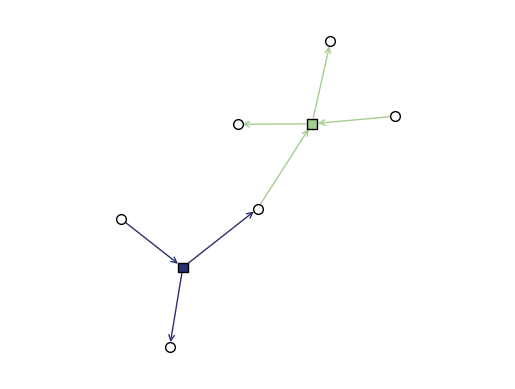
We can draw a dihypergraph using the function draw_bipartite()
[5]:
xgi.draw_bipartite(DH1)
[5]:
(<AxesSubplot: >,
 (<matplotlib.collections.PathCollection at 0x139f08c90>,
  <matplotlib.collections.PathCollection at 0x139f0a8d0>))
Views
Nodes and edges are represented by DiNodeView and DiEdgeView respectively.
[6]:
DH.nodes
[6]:
DiNodeView((0, 1, 2, 3, 4, 5, 6, 7))
[7]:
DH.edges
[7]:
DiEdgeView((0, 1, 2, 'one', 'two'))
We can access directed edges with the dimembers() method and the union of the head and tail with members().
[8]:
print("Edge 0:")
print(DH.edges.dimembers(0))
print(DH.edges.members(0))
print("\nThe edge list as a whole:")
print(DH.edges.dimembers())
print(DH.edges.members())
Edge 0:
({1, 2, 3}, {3, 4})
{1, 2, 3, 4}

The edge list as a whole:
[({1, 2, 3}, {3, 4}), ({1, 2}, {5, 6}), ({4}, {1, 3}), ({0, 1}, {1, 2}), ({2, 3, 4}, set())]
[{1, 2, 3, 4}, {1, 2, 5, 6}, {1, 3, 4}, {0, 1, 2}, {2, 3, 4}]
The naming convention is the same for node memberships.
[9]:
print("memberships for node 0:")
print(DH.nodes.dimemberships(0))
print(DH.nodes.memberships(0))

print("\nAll node memberships:")
print(DH.nodes.dimemberships())
print(DH.nodes.memberships())
memberships for node 0:
(set(), {'one'})
{'one'}

All node memberships:
{0: (set(), {'one'}), 1: ({2, 'one'}, {0, 1, 'one'}), 2: ({'one'}, {0, 1, 'two'}), 3: ({0, 2}, {0, 'two'}), 4: ({0}, {2, 'two'}), 5: ({1}, set()), 6: ({1}, set()), 7: (set(), set())}
{0: {'one'}, 1: {0, 1, 2, 'one'}, 2: {0, 1, 'one', 'two'}, 3: {0, 2, 'two'}, 4: {0, 2, 'two'}, 5: {1}, 6: {1}, 7: set()}
We can also access the head and tail of an edge:
[10]:
print("Head and tail of edge 0:")
print(DH.edges.head(0))
print(DH.edges.tail(0))

print("\nThe head as a whole:")
print(DH.edges.head())

print("\nThe tail as a whole:")
print(DH.edges.tail())
Head and tail of edge 0:
{3, 4}
{1, 2, 3}

The head as a whole:
[{3, 4}, {5, 6}, {1, 3}, {1, 2}, set()]

The tail as a whole:
[{1, 2, 3}, {1, 2}, {4}, {0, 1}, {2, 3, 4}]
Stats
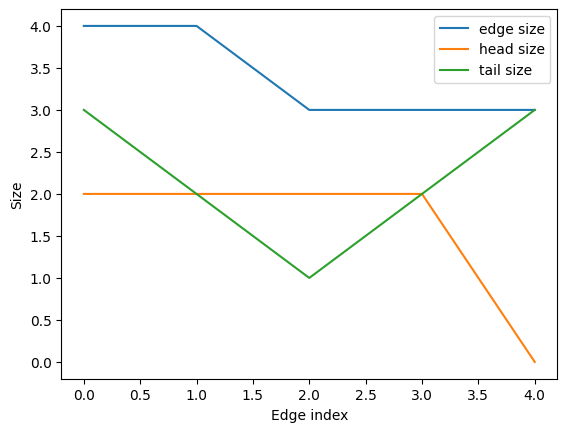
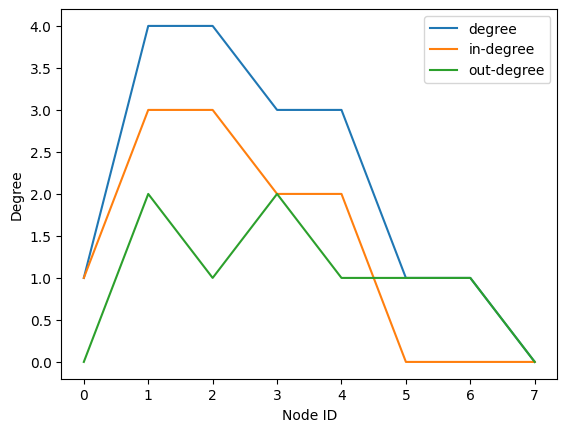
The DiNodeStat and DiEdgeStat represent directed node and edge statistics. For nodes, we have in_degree, out_degree, and degree and for edges, we have size, order, head_size, and tail_size.
[11]:
s = DH.edges.size.asnumpy()
s_in = DH.edges.head_size.asnumpy()
s_out = DH.edges.tail_size.asnumpy()
[12]:
plt.plot(s, label="edge size")
plt.plot(s_in, label="head size")
plt.plot(s_out, label="tail size")
plt.legend()
plt.ylabel("Size")
plt.xlabel("Edge index")
plt.show()
[13]:
k = DH.nodes.degree.asnumpy()
k_in = DH.nodes.in_degree.asnumpy()
k_out = DH.nodes.out_degree.asnumpy()
[14]:
plt.plot(k, label="degree")
plt.plot(k_in, label="in-degree")
plt.plot(k_out, label="out-degree")
plt.legend()
plt.ylabel("Degree")
plt.xlabel("Node ID")
plt.show()
We can convert from dihypergraphs to hypergraphs through the constructor…
[15]:
H = xgi.Hypergraph(DH1)
H.edges.members()
[15]:
[{1, 2, 5, 6}, {1, 3, 4}]
…or through the convert module.
[16]:
H = xgi.to_hypergraph(DH1)
H.edges.members()
[16]:
[{1, 2, 5, 6}, {1, 3, 4}]