XGI in 5 minutes
Hello!
If you’re new to XGI, you might want to check out the XGI in 1 minute tutorial for a quick introduction.
Getting Started
Let’s import XGI in the usual way, and this time we’ll need a few other standard Python libraries too.
[1]:
import matplotlib.pyplot as plt

import xgi
To check the version of XGI you have, simply type:
[2]:
xgi.__version__
[2]:
'0.7.4'
Creating a Random Hypergraph
In XGI, you have several options to create a hypergraph. You can build an empty one and add nodes and edges manually (as we have seen in the XGI in 1 minute tutorial), or you can use our handy generators. For this tutorial, let’s use a simple generator to create a random hypergraph. If you’re curious about other generators, feel free to explore the focus tutorial on generators or consult the documentation.
To create a random hypergraph, use this function:
[3]:
N = 20
ps = [0.1, 0.01]
H = xgi.random_hypergraph(N, ps, seed=1)
This function generates a random hypergraph with N nodes, connecting any d+1 nodes with a hyperedge using probability ps[d-1].
You can also print the hypergraph and access the list of nodes and edges like this:
[4]:
print(H)
print(H.nodes)
print(H.edges.members())
Unnamed Hypergraph with 20 nodes and 36 hyperedges
[0, 1, 2, 3, 4, 5, 6, 7, 8, 9, 10, 11, 12, 13, 14, 15, 16, 17, 18, 19]
[{0, 3}, {0, 6}, {0, 15}, {1, 9}, {1, 10}, {1, 13}, {2, 4}, {16, 2}, {3, 5}, {3, 14}, {19, 5}, {6, 14}, {10, 7}, {16, 7}, {17, 7}, {18, 7}, {8, 18}, {9, 17}, {9, 19}, {10, 15}, {16, 10}, {16, 12}, {17, 12}, {18, 14}, {19, 15}, {0, 4, 14}, {1, 15, 7}, {1, 12, 14}, {17, 2, 6}, {18, 3, 5}, {18, 3, 6}, {11, 17, 3}, {3, 12, 15}, {18, 15, 7}, {10, 19, 15}, {18, 12, 14}]
Plotting a random hypergraph
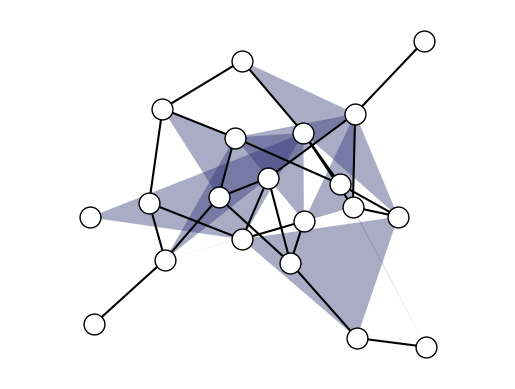
Visualization is crucial for understanding complex data structures. To plot your hypergraph using the default layout, use this:
[5]:
pos = xgi.barycenter_spring_layout(H, seed=1)
xgi.draw(H, pos=pos);
XGI also offers several ways to personalize your plots for higher-order structures. For more options, explore the focus tutorial on plotting or consult the documentation.
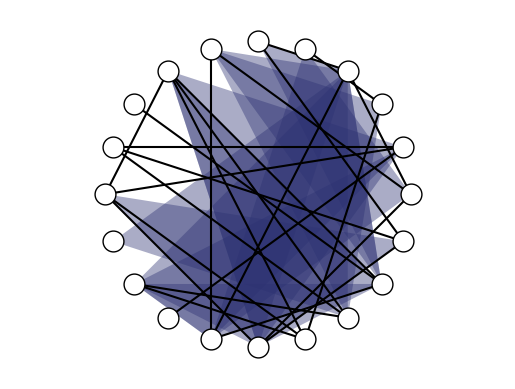
For example, you can place the nodes on a circle:
[6]:
pos_circular = xgi.circular_layout(H)
xgi.draw(H, pos=pos_circular);
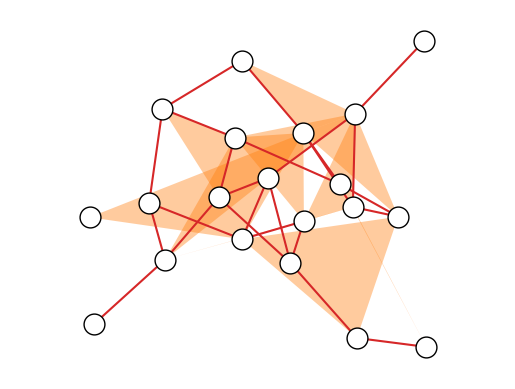
Or change the colors of hyperedges and links:
[7]:
xgi.draw(H, dyad_color="tab:red", edge_fc="tab:orange", pos=pos);
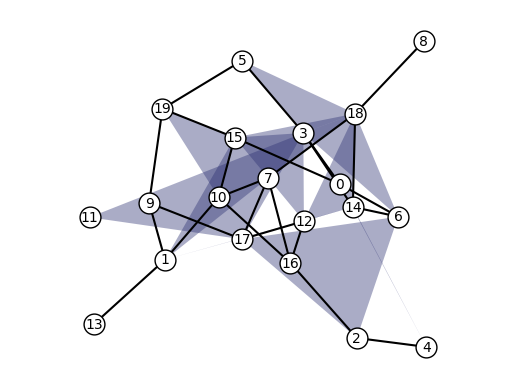
Adding node labels is another handy feature:
[8]:
xgi.draw(H, node_labels=True, pos=pos);
Accessing the maximum order of your hypergraph
You might need to know the maximum number of edges in your hypergraph. To do that, simply use this:
[9]:
xgi.max_edge_order(H)
[9]:
2
This can be particularly helpful when working with larger and more complex structures.
Listing All Edge Sizes
To access all the edge sizes in your hypergraph, use this:
[10]:
xgi.unique_edge_sizes(H)
[10]:
[2, 3]
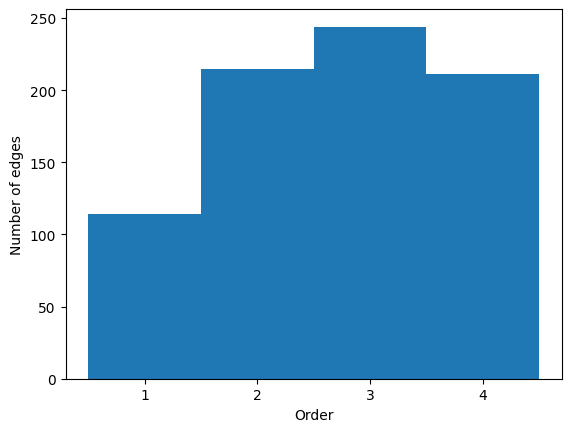
Histogram of the edge sizes
Let’s take things up a notch and perform a more detailed analysis on a hypergraph: plotting a histogram of the edges’ orders.
First, let’s create a larger and more intricate random hypergraph:
[11]:
N_new = 50
ps_new = [0.1, 0.01, 0.001, 0.0001]
H_new = xgi.random_hypergraph(N_new, ps_new)
To access the order of the edges, use the stats function. For a deeper dive into this, check out the focus tutorial on statistics or consult the documentation. You can obtain a list of all the edge orders and then create a histogram in the usual way.
[12]:
list_of_orders = H_new.edges.order.aslist()
plt.hist(
    list_of_orders,
    bins=range(min(list_of_orders), max(list_of_orders) + 2, 1),
    align="left",
)
plt.xticks(range(min(list_of_orders), max(list_of_orders) + 1, 1))
plt.xlabel("Order")
plt.ylabel("Number of edges");
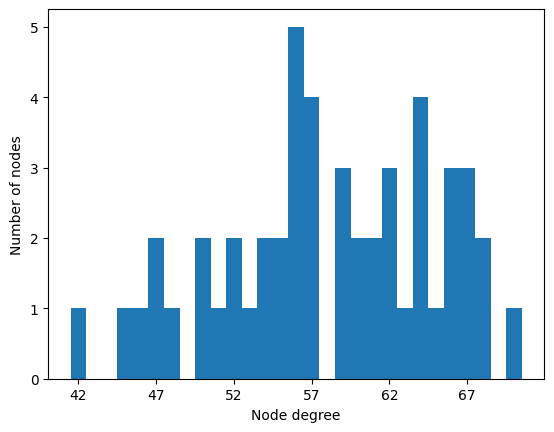
Histogram of the Node Degrees
Similarly, using the stats function, you can create a histogram of the node degrees in your hypergraph:
[13]:
nodes_degrees_list = H_new.nodes.degree.aslist()
plt.hist(
    nodes_degrees_list,
    bins=range(min(nodes_degrees_list), max(nodes_degrees_list) + 1, 1),
    align="left",
)
plt.xticks(range(min(nodes_degrees_list), max(nodes_degrees_list) + 1, 5))
plt.xlabel("Node degree")
plt.ylabel("Number of nodes");
Wrapping Up
Well done! 👏 You’ve covered a lot in just 5 minutes with XGI. We hope you enjoyed this tutorial, and there’s much more to explore! Check out other tutorials here!